Raman spectrometer and infrared spectroscopy are powerful tools for the study of molecular structure and configuration, material composition identification, and structural analysis. Due to their non-destructive, high sensitivity, and short detection times, they have a wide range of applications in physics, chemistry, biology, mineralogy, archaeology, and industrial product quality control.
Principle and Difference

(1) Raman Spectrometer
When light hits a material, photons collide with electrons in molecules, and inelastic collisions occur, and some of the energy of the photons is transferred to the electrons. In this case, the frequency of the scattered light is not equal to the frequency of the incident light. The scattering is called Raman scattering, and the resulting spectrum is called the Raman spectrum. Raman spectroscopy is a method by which information on the internal structure of molecules can be obtained by measuring the change in frequency of the scattered light relative to the incident light.
(2) Infrared Spectrometer
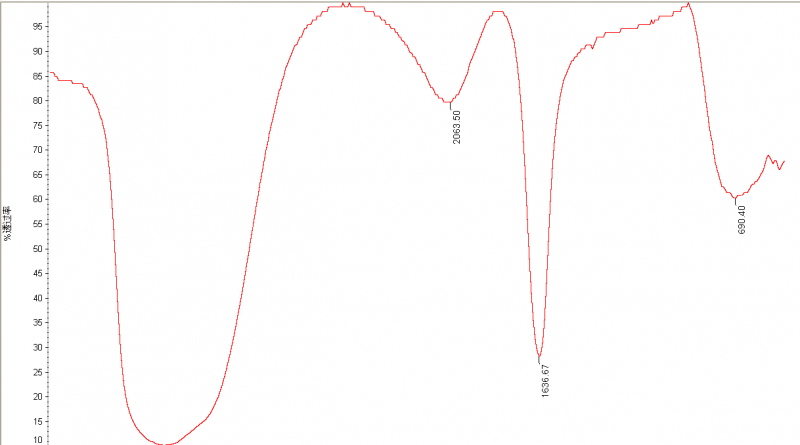
When a sample is irradiated with infrared light of continuously changing frequency, molecules absorb certain frequencies of radiation, and the net change of dipole moment caused by its vibrational or rotational motion, the resulting molecular vibration and rotational energy level jump from the fundamental state to the excited state, so that the intensity of transmitted light corresponding to these absorption regions is weakened. Plotting the measured absorption intensity against the wavelength or wavenumber of the incident light is the infrared spectrum. The method of structural analysis, characterization, and quantification using the selective absorption of radiation in the infrared region of the material is called infrared absorption spectroscopy.
Raman spectroscopy and infrared spectroscopy exist as complementary techniques in analytical techniques.
Common to both:
Both are infrared absorption frequencies equal to the Raman shift for a given chemical bond, and both represent the energy of the first vibrational energy level. Thus, for a given compound, some peaks have identical IR absorption wavelengths and Raman shifts, and both IR absorption wavelengths and Raman shifts are in the IR optical region, both of which reflect structural information about the molecule. Raman spectroscopy, like infrared spectroscopy, is used to detect the vibration and rotation energy levels of molecules of matter.
Differences and comparisons
| Infrared Spectrometer | Raman Spectrometer | |
| Mechanisms | Vibration-induced changes in the dipole moment or charge distribution of molecules | Due to the transient deformation of the electron cloud distribution on the bond causing temporary polarization, a change in the polarization rate produces an induced dispole, which scatters when returning to the fundamental state. |
| Detection Range | 400-4000cm-1 | 40-4000cm-1 |
| Spectral Generation Method | Absorption Spectroscopy | Scattering Spectroscopy |
| Detecting Objects | Dipole moments of chemical molecules | Electron cloud polarization of molecules |
| Testing Requirements | Neste lamps, silicon carbide rods, etc. as light sources Samples require pre-processing | Laser Light Source Samples do not require pre-processing |
| Sample Request | Strong absorption of water, severely affecting test results and limiting applications | phamaceuticals, chemicals, etc. |
| Mapping Information | Reflective molecular functional groups | Reflects the molecular skeleto and analyzes biomolecules. |
Difference between Infrared Spectroscopy and Raman Spectroscopy Detection Mechanisms
| Dipole Moment Variation | Infrared Spectrometer | Raman Spectrometer |
| obvious | Strong Absorption Peak | Weak Absorption Peak |
| not obvious | Weak Absorption Peak | Stong Absorption Peak |
| almost no | Hardly ever | Strongest Raman Peak |


 +86 769-22667715
  sales@rayclouds.net
 Floor 1&2, Building B, Dongguan Institute of Opto-electronics Peking University, No.17,Qinyuan Road, Songshan Lake, Dongguan City, Guangdong Province. China